Clinical Report with R
R for TFL
2024-07-26
Why R?

Free to use in your local laptop forever

Open-source is always be appreciated
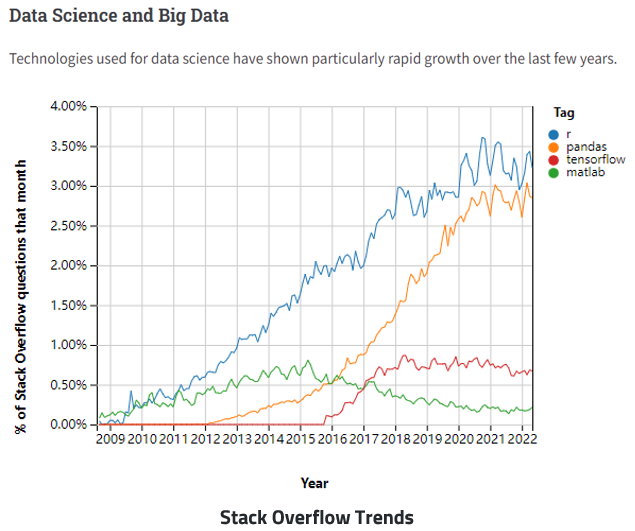
R gains popularity in Big Data Era
Create and Output Tables/Figures with R
General Ways
Create and Output Tables/Figures with R
Packages developed by Pharma
Concept for creating tables in R
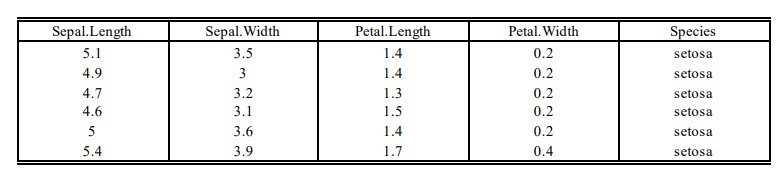
- Create a data.frame
- Transform 2-dimensional data to an table object (R list with attributions for output)
- Format table in correlated list blocks
- Translate/Encode to desired format (HTML, LaTeX, RTF)

Simple r2rtf example
R markdown workflow (knit the document)
Precisely, R markdown is pandoc’s markdown. It combines plain text and R codes (maybe other language code) together, use knitr package as core to create a md file which includes the code and its output. The markdown file generated by knitr is then processed by pandoc, http://pandoc.org/, which is responsible for creating the finished file.

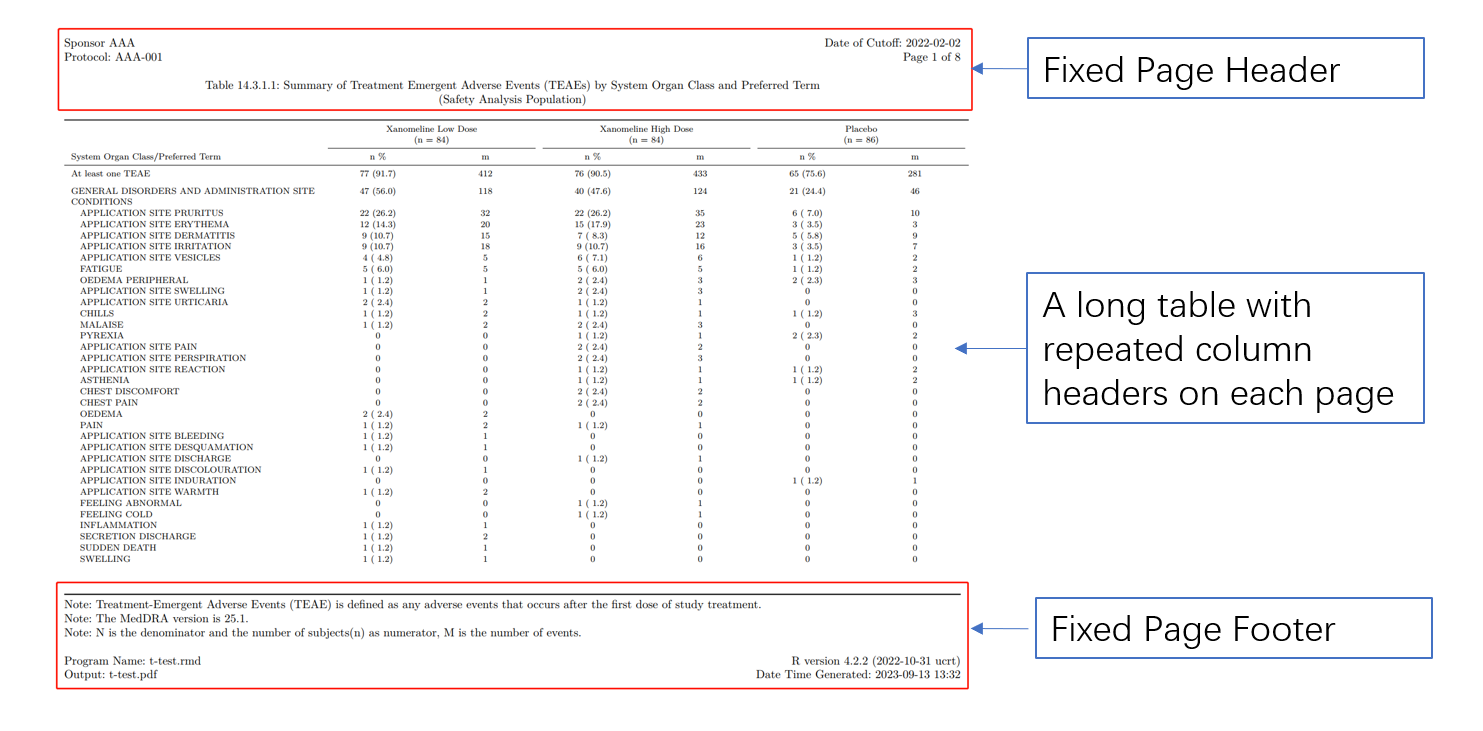
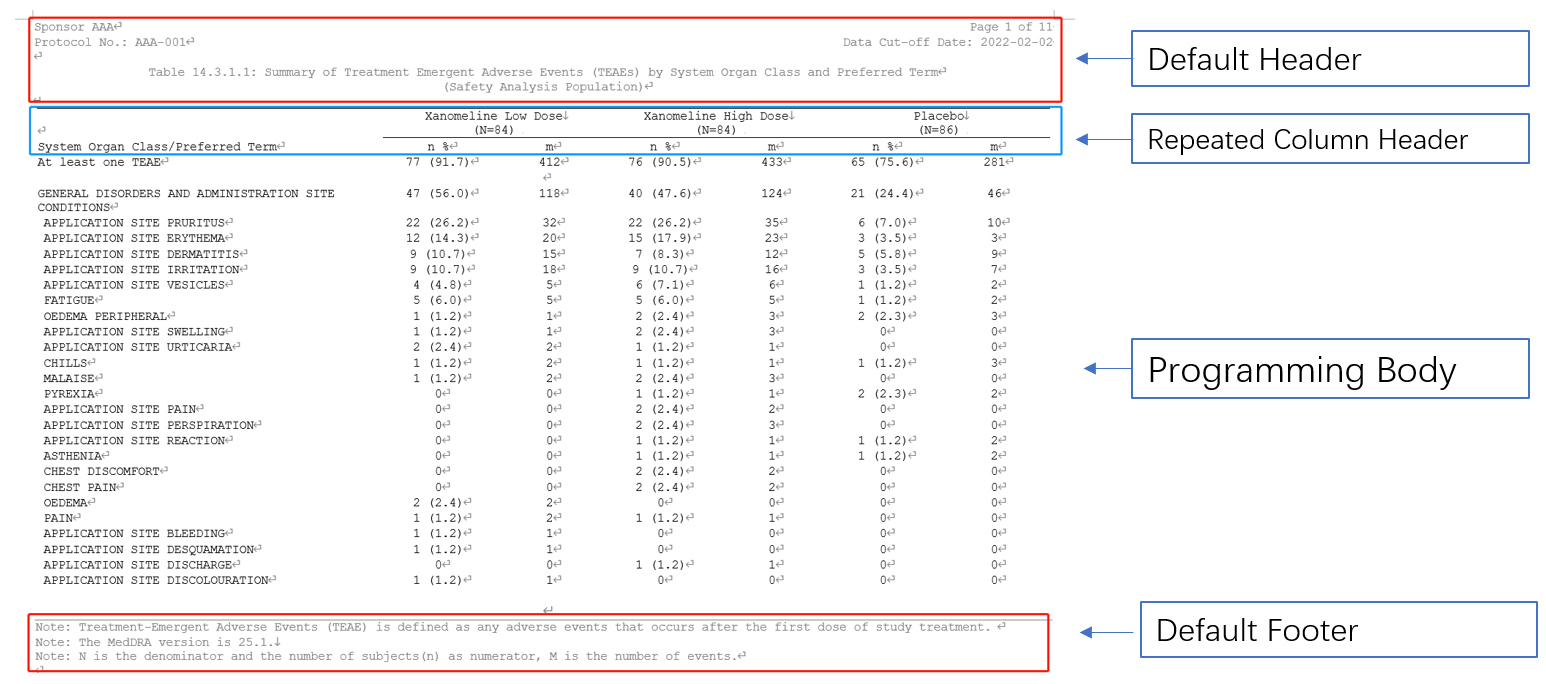
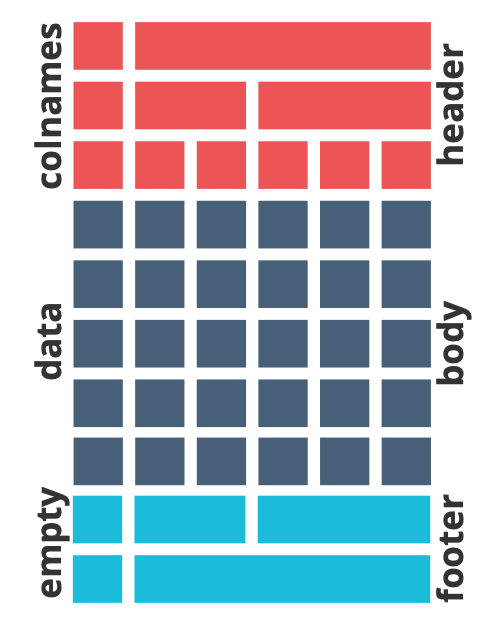
Elements to construct a table
Our shell and table template are always constructed by 3 part:
Header + body + footer
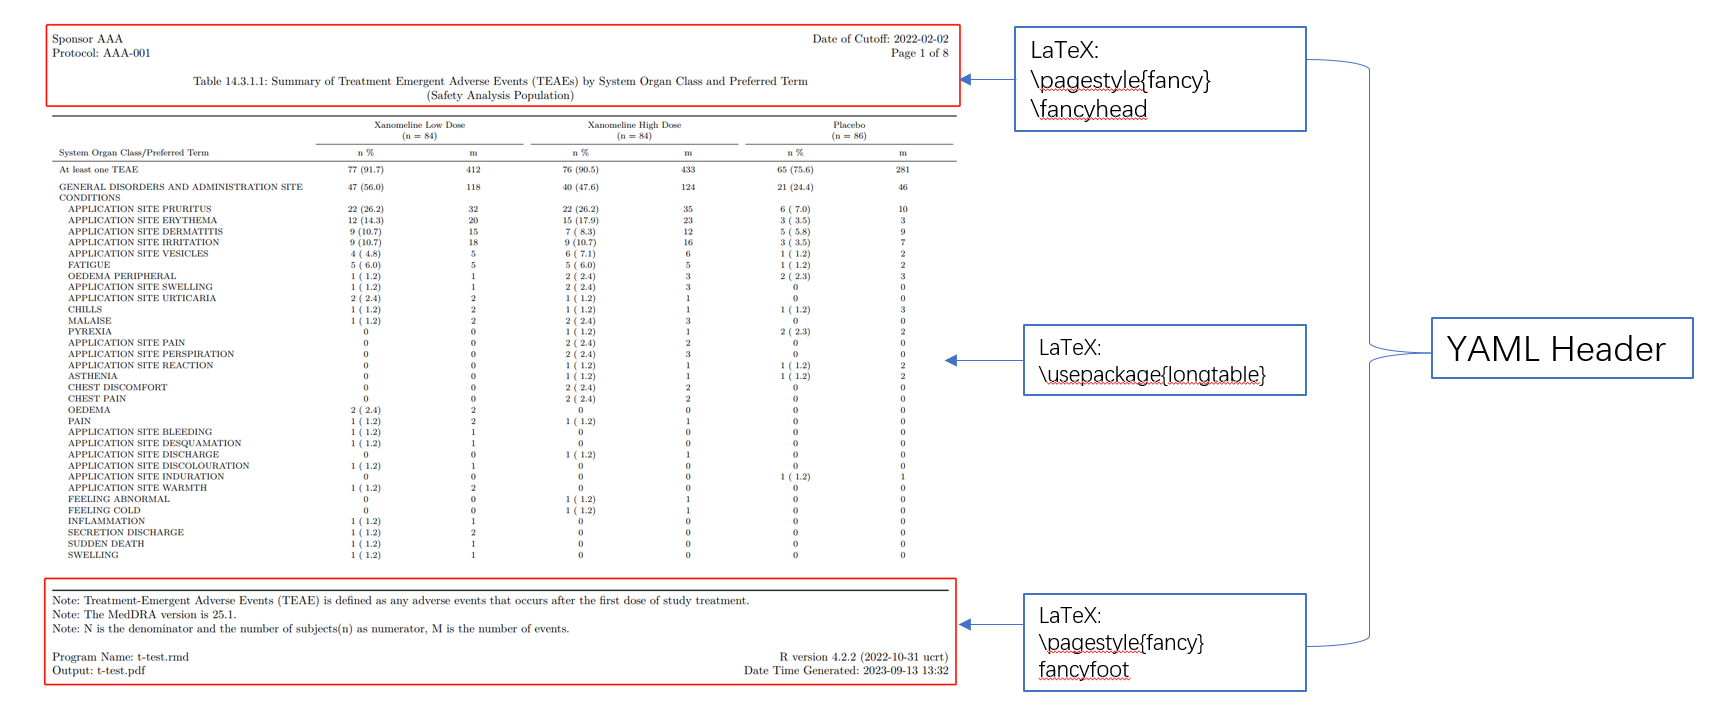
In LaTeX, this is a frequently used format with developed package fancyhdr
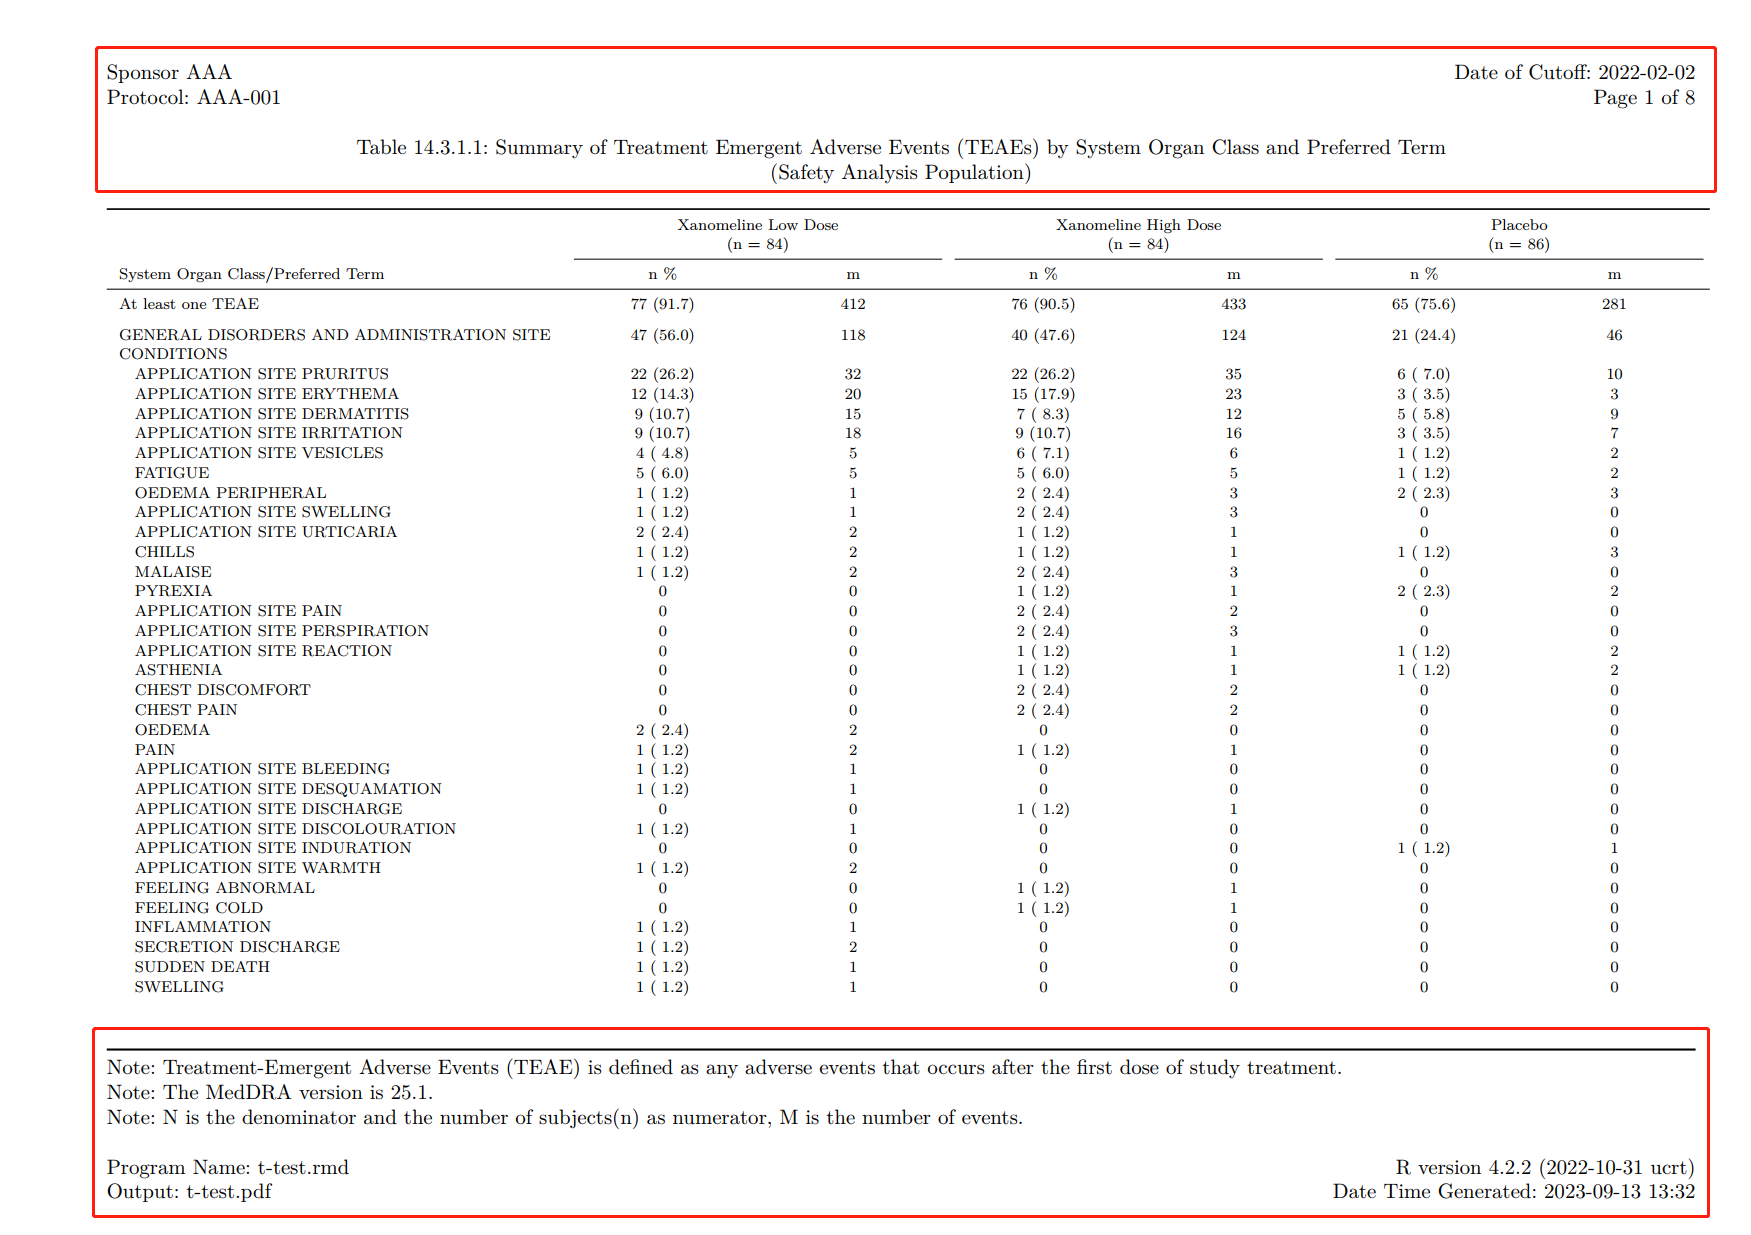
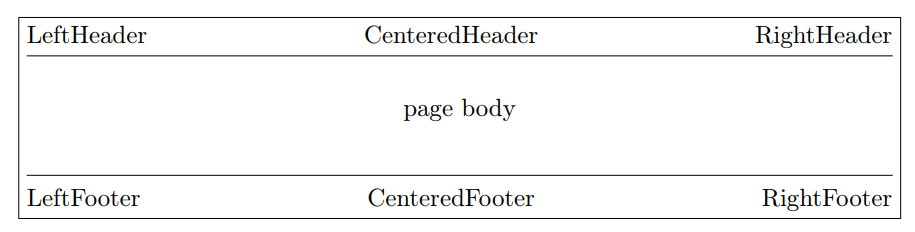
Table elements
Include header and footer with YAML
Enhanced Output with knitr::kable() and kableExtra
output<- kable(final, longtable=T, booktabs=T, align='lcccccc',
      escape=F,
      caption=c("\\newline"),
      col.names = linebreak(c("System Organ Class/Preferred Term","n \\%", "m", "n \\%", "m", "n \\%", "m"),
                            align = "c"),
      linesep = sep_v
      ) %>%
  add_indent(ind_num) %>%
  add_header_above(c(" ", "Xanomeline Low Dose \n (n = 84)"=2, "Xanomeline High Dose \n (n = 84)"=2, "Placebo \n (n = 86)" = 2), line=T, bold = F) %>%
  kable_styling(latex_options = c("repeat_header"),
                font_size = 7.5,
                position = "l",
                repeat_header_text = "",
                repeat_header_method = "append") %>%
  column_spec(1, width = "2.9in") %>%
  column_spec(2:7, width = "1.1in")

output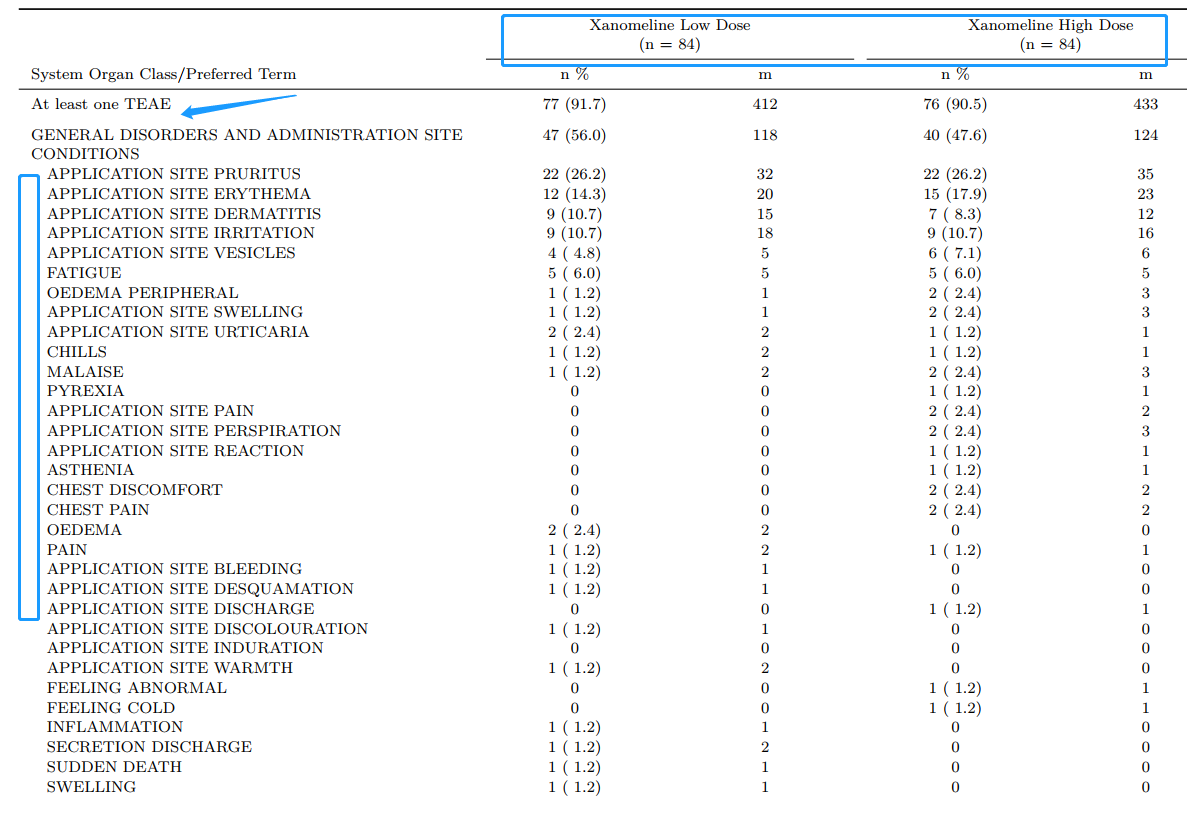
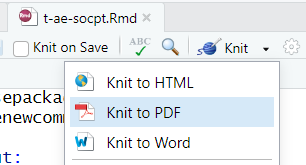
Render to PDF document
knit button (Ctrl + Shift + K)
In console:
rmarkdown::render("t-ae-socpt.Rmd", "t-ae-socpt.pdf")
Roles with responsibility
Statisticians still write shell followed internal rules
![]()
Lead programmer should set up
TLF-start.rat the beginning of TLF work and applyread_tfl_titlefoot.sasto create metadata including all titles and footnotesProd/Dev programmer need to assign these objects in
TLF-start.rand run code when initiate each TLF.

Awesome combo: flextable + officer
![]()
flextablepackage provides a framework for easily creating tables for reporting and publications. Functions are provided to let users create tables, modify and format their content.![]()
officeris designed to produce content that is essentially composed of tables, graphs, and is ideal in cases for clinical reporting and automation of reporting in compliance with the official corporate templates


Table design
The concept of table design in flextable to RTF output is quite same as LaTex PDF we discussed in previous chapters. We can migrate the programming body part into this procedures as well. Create a flextable object and customize the column headers and data body.
What’s more is happening?
End-to-End Clinical Reporting Packages
![]() OAK is an open-source community project to evolve software that uses agnostic transformation logic to enable mapping of CDASH to SDTM whose functionality will also generate raw synthetic data.
OAK is an open-source community project to evolve software that uses agnostic transformation logic to enable mapping of CDASH to SDTM whose functionality will also generate raw synthetic data.
 OAK is an open-source community project to evolve software that uses agnostic transformation logic to enable mapping of CDASH to SDTM whose functionality will also generate raw synthetic data.
![]() To provide an open source, modularized toolbox that enables the pharmaceutical programming community to develop ADaM datasets in R.
To provide an open source, modularized toolbox that enables the pharmaceutical programming community to develop ADaM datasets in R.
 To provide an open source, modularized toolbox that enables the pharmaceutical programming community to develop ADaM datasets in R.
What’s more is happening?
End-to-End Clinical Reporting Packages
![]() Serves as a single tool to create SAS transport files and perform pharma specific dataset level validation checks
Serves as a single tool to create SAS transport files and perform pharma specific dataset level validation checks
 Serves as a single tool to create SAS transport files and perform pharma specific dataset level validation checks
![]() To represent and exchange R package source code as text files
To represent and exchange R package source code as text files
 To represent and exchange R package source code as text files
Thanks
![]()