“Clinical Report with R” is on of workshop I made in summer of 2024. The core is developing TFL workflow in R, which is a migration from our SAS workflow to R. However, comparing with common programming method to generate TFL, more efficient, automatical visualization tool is desired by our department. So, I turned to another powerful solution, R Shiny.
Introduction to R Shiny
Shiny is an R package that makes it easy to build interactive web applications (apps) straight from R without any frontend knowledge(HTML, CSS, or JavaScript).
install.packages("shiny")
Components of Shiny app
The UI (short for user interface) which defines how your app looks
The server function which defines how your app works
A RShiny-based interactive data exploration framework
Modularized and standardized building blocks
Collection of specialized R packages
Streamlines creation of web-apps that offers:
Dynamic filtering facility
Code reproducibility
Reporting engine
Many data summarization and visualizations
Traditional Shiny App
teal workflow
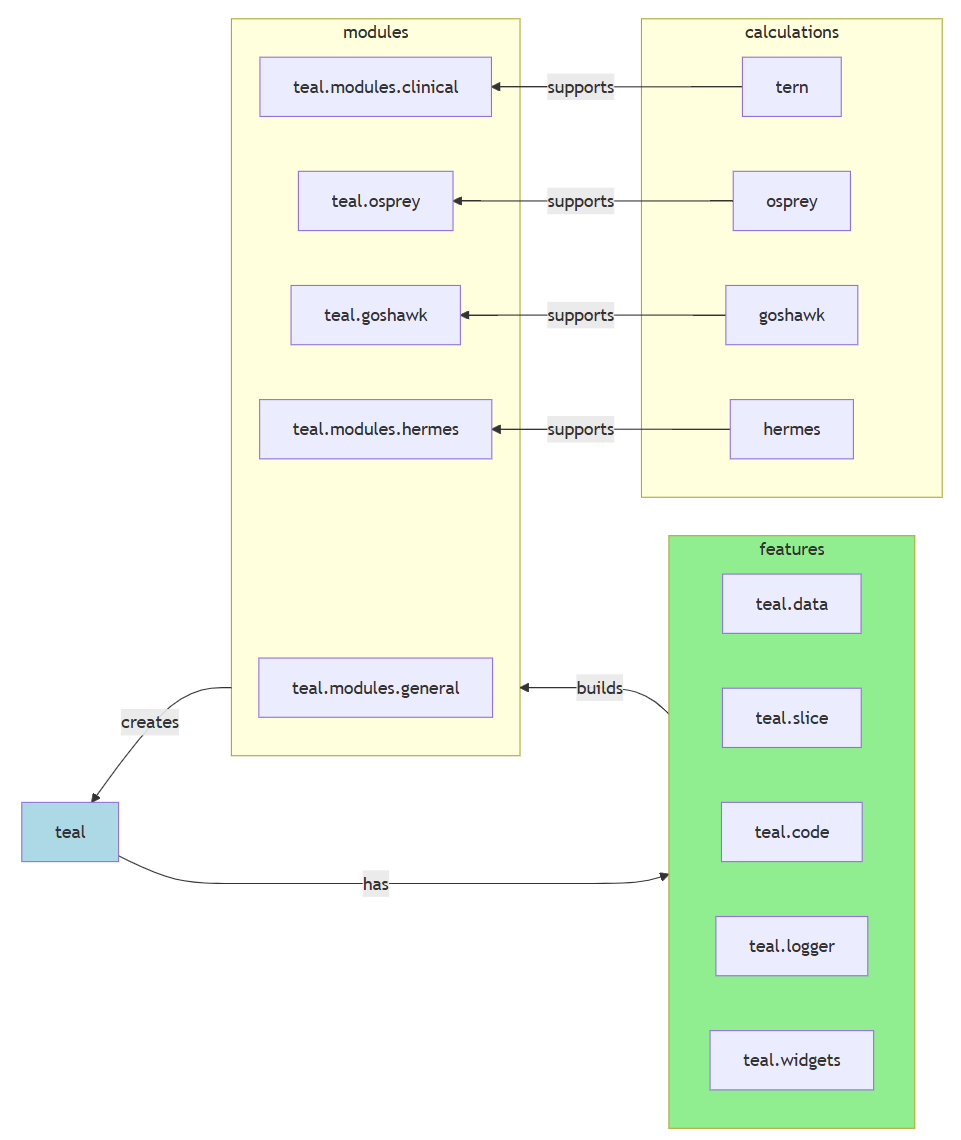
teal product map
Why choose teal?
Spending months on diving into open-source solutions to statistical analysis. I picked teal for app development baseline framework for the rest but not least reasons:
teal is an interactive data exploration framework based on shiny, designed primarily to analyze CDISC clinical trial data
teal framework provides application developers with a wide range of customizable standard analysis modules
No need to spending a lot of time on UI/UX matters (Bootstrap V5 themes since teal v1.0.0)
Built by renowned Roche NEST project team, accepted and collaborated with multiple big pharma. (Sustained development)
Rich source of help documents and examples.
Challenges in development
Rich source of help documents and examples, which also brought steep learning curve and burdens.
Lack of Shiny basic knowledges.
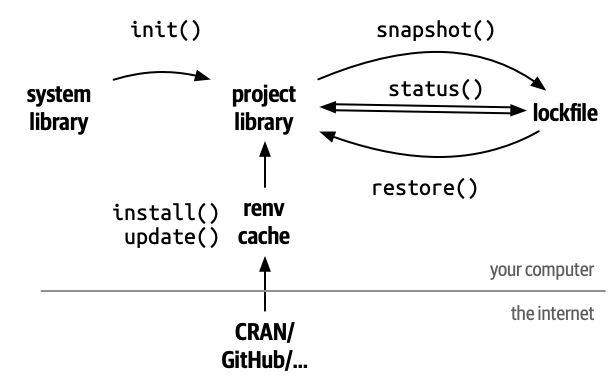
Reproducible R environment and continuous integration.
AI performed not ideally in solving teal development problems.
Actors
Roles
Primary Responsibility
teal app user
Use app to product statistical reports, all faculty in BIOS. R knowledge is not required.
teal app developer
Create app from built functions from teal ecosystem. Need intermediate R skills like Basic, tidyverse, Shiny, functional programming. Have to learn teal framework with bunch of resources.
teal module developer
Create customized modules on internal analysis purpose. Need a little advanced R knowledge. Understand reactive programming in Shiny, meta-programming for source development, familiar with table-grammar R packages like rtables, draw complicated plots with ggplot2, rendering engine R packages for output, so and so forth.
teal framework developer
Roche NEST project team and collaborators from other open-source developing team. Create and maintain this frameworks by those SDEs and data scientists.
App Development and how to use
teal4dv
teal4dv is the given name for this shiny app, created and modified from teal ecosystem designed and open sourced by Roche NEST Project. This app is developed for internal use by Innocare Biostat team, applied for statistical monitor and data visualization purpose.
This app (teal4dv v0.0.0.9000) is created for local use at beginning. We will figure out server deployment strategy in future.
App Structure
It was created via usethis::create_package() to make this app a r-package like structure. App version is recorded in DESCRIPTION file.